Profiling WordPress REST API requests
Are those REST API endpoints responding as quickly as they should? Or, perhaps there are some problems with the returned data you want to dig into?
The ever-useful Query Monitor makes it nice and easy to get additional insights, as it can inject extra information (including a list of database queries) into the API responses. Here's my basic recipe.
- Start by installing and activating Query Monitor.
- Take it for a test drive: open an admin page and click on the Query Monitor section of the admin toolbar, then open the database queries tab. If things are setup correctly, you should not see any warnings (like the one shown in the following screenshot):
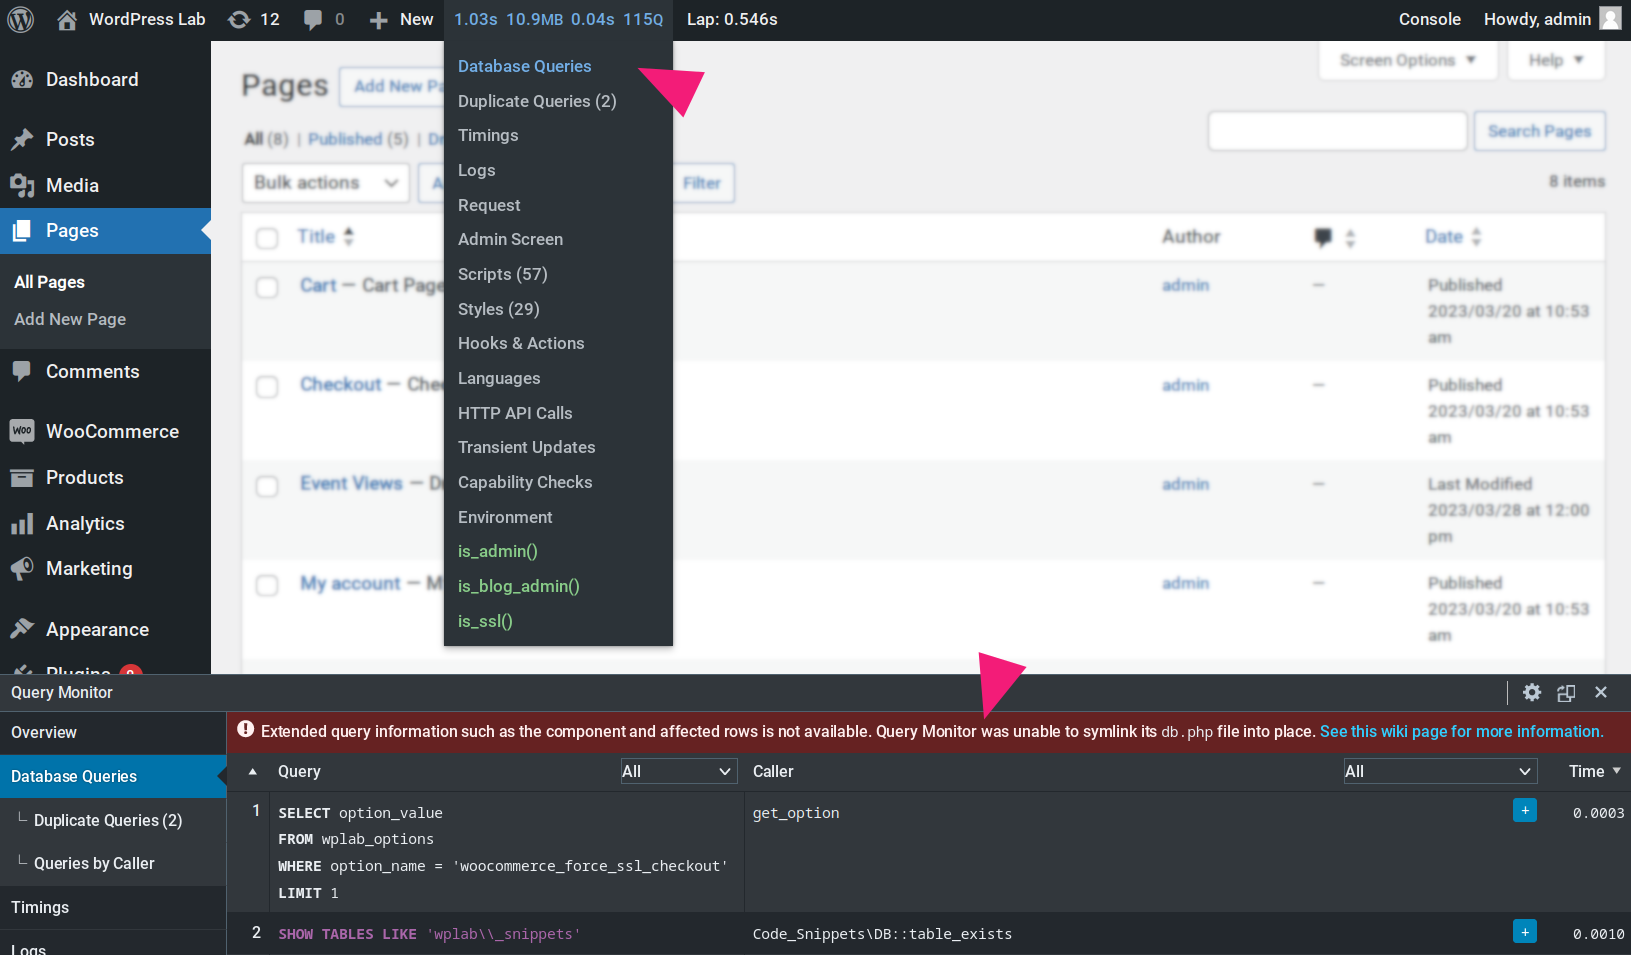
- If you do hit difficulties like this, follow the advice in the plugin wiki.
- Take it for a test drive: open an admin page and click on the Query Monitor section of the admin toolbar, then open the database queries tab. If things are setup correctly, you should not see any warnings (like the one shown in the following screenshot):
- For security (and perhaps performance) reasons, Query Monitor doesn't supply debug information to just anyone. So, when using it to examine REST API responses, you will need to follow this guidance on authentication. Or, if you are working locally on a test site without any sensitive data, you could use a snippet like the following (I hope it goes without saying that this could be risky in any other environment):
// Make it so the current user can always view query monitor,
// regardless of who the current user actually is.
add_filter( 'user_has_cap', function ( $capabilities ) {
	$capabilities['view_query_monitor'] = true;
	return $capabilities;
} );- Now we're all set to debug some API requests! To maximize our insights we're going to need to use enveloped requests which really just means supplying the
_envelopeparameter in the URL. Here's an example, using CURL and WordPress's own posts endpoint (I'm saving the response in a temporary file—this is just to make it fast and easy to perform various tests without repeated fetches):
curl "local.site/wp-json/wp/v2/posts?_envelope" > /tmp/http-response- Now, we can examine the response using utilities like jq.
- To get a high-level sense of what sort of debug information is available, you might try
jq .qm /tmp/http-response | jq -c "keys_unsorted". - You can check for duplicate queries with
jq .qm.db_queries.dupes /tmp/http-response. - Or count the number of database queries used to form the response with
jq .qm.db_queries.wpdb.total /tmp/http-response. - To check the total time spent in database queries, try
jq .qm.db_queries.wpdb.time /tmp/http-response. - Getting a little fancier, discover how long the longest running query took to execute, with
jq ".qm.db_queries.wpdb.queries[].time" /tmp/http-response | sort -n | tail -n1.
- To get a high-level sense of what sort of debug information is available, you might try
There are lots of different angles to examine using this sort of approach:
- By profiling a variety of responses from various endpoints, we can start to build a picture of how many "baseline" queries are going to execute on each request (queries triggered by WordPress itself, as part of how the system operates).
- We might also start detecting unwanted additional queries inadvertently added on each request by other plugins.
- Or, we may see obvious opportunities for caching—and much more.